Tip: Start typing in the input box for immediate search results.
Reporting in BruceBEM
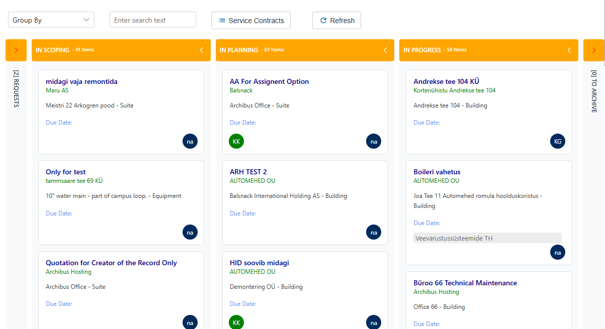
Kanban.
Kanbans are available for Tasks, Work Requests and Quotations. Kanban is a visual report that represents the status of the element.
Dashboards.
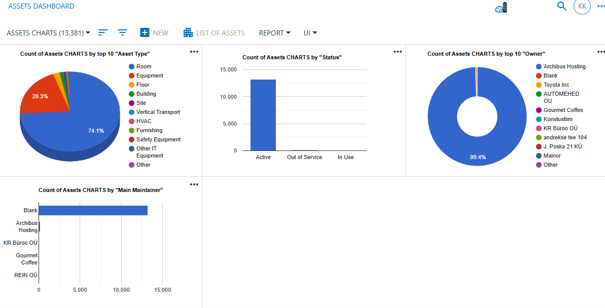
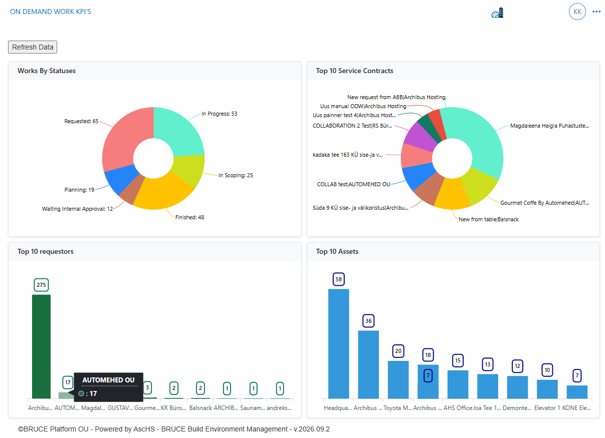
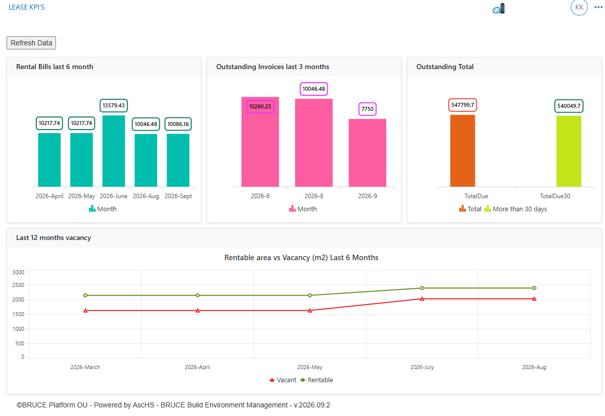
A Dashboard is a graphical report that aggregates, groups, and calculates KPIs or other parameters. The dashboard shows the current or historical situation about business values or performance.
Aggregated data in Tables.
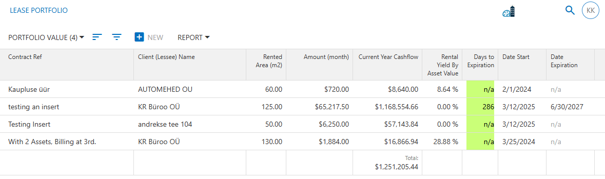
The table view is the most common way to represent the data. Table views can use specific aggregation functions to turn the table into a useful report. For example, the Leases and Lease Portfolio Valuation. The Current Year Cash Flow and Rental Yield are valuable KPI’s, calculated on the fly.
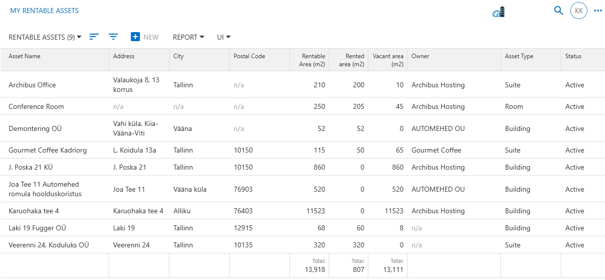
Second example: Assets, My Rentable Assets. The table shows only the buildings, rooms, rentable suites. It aggregates the vacant areas and rented areas by calculating the result based on active Lease Contracts.
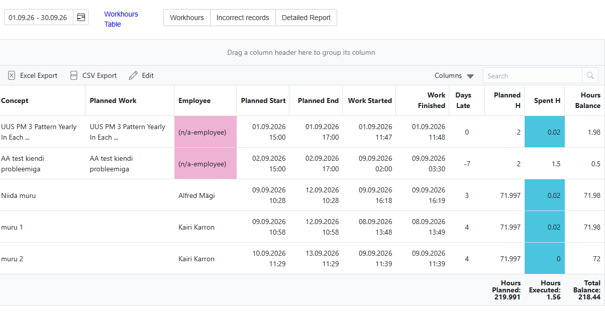
Examples of Special Reports
Workhours Report’s
Costs Report’s
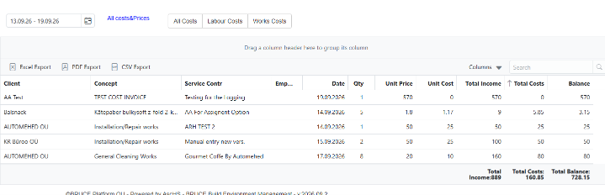
.